Federal Debt and Surplus
(NOTE: On the charts, fiscal year boundaries for each Presidential administration were corrected on 12/31/2009. Each President inherited a budget adopted under the previous President so didn't have his own budget until the fiscal year that began under his administration. The Federal fiscal year begins on October 1 and ends on September 30 of the stated year; so, for example, President Obama's first budget, for Fiscal Year 2010, begins on October 1, 2009, although he took office in January 2009, operating under President George W. Bush's last budget.)
The information on this page is from Federal Office of Management and Budget.
Chart 1. This chart shows Federal government receipts (revenues) and outlays (expenditures) beginning in 1940. The gap between receipts and outlays is the deficit (if outlays are higher) or surplus (if receipts are higher). Data in "constant 2000 dollars" (that is, adjusted for inflation, with the year 2000 as the base) is used.
Changes in future receipts and outlays resulting from health care reform have not been included yet.
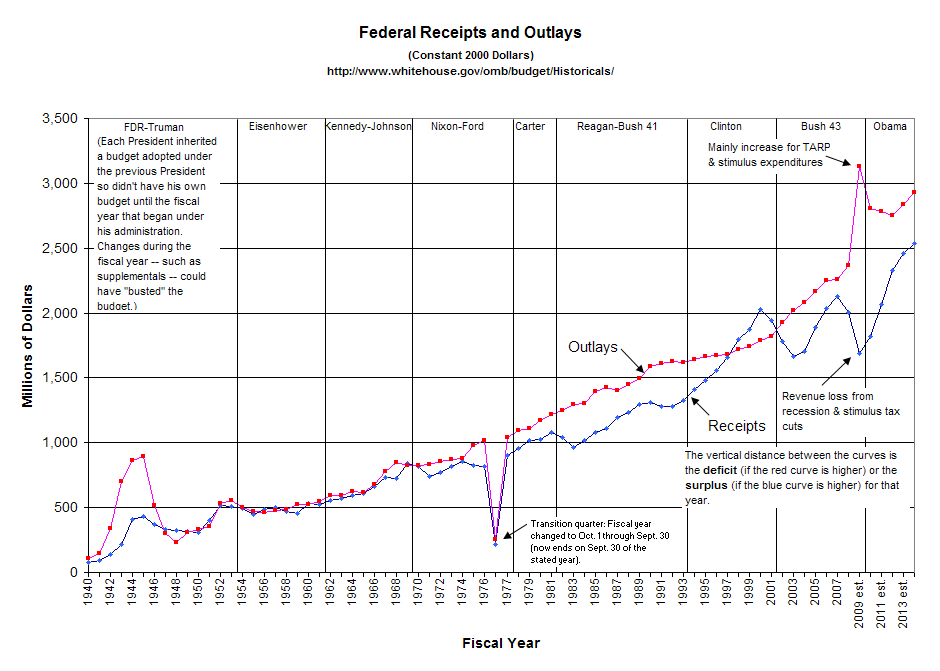
Chart 2. The amount of annual Federal deficit (excess of outlays over receipts) or surplus is often stated as a percentage of Gross Domestic Product (GDP) to express the significance of the debt or surplus by comparing it to the national economy.
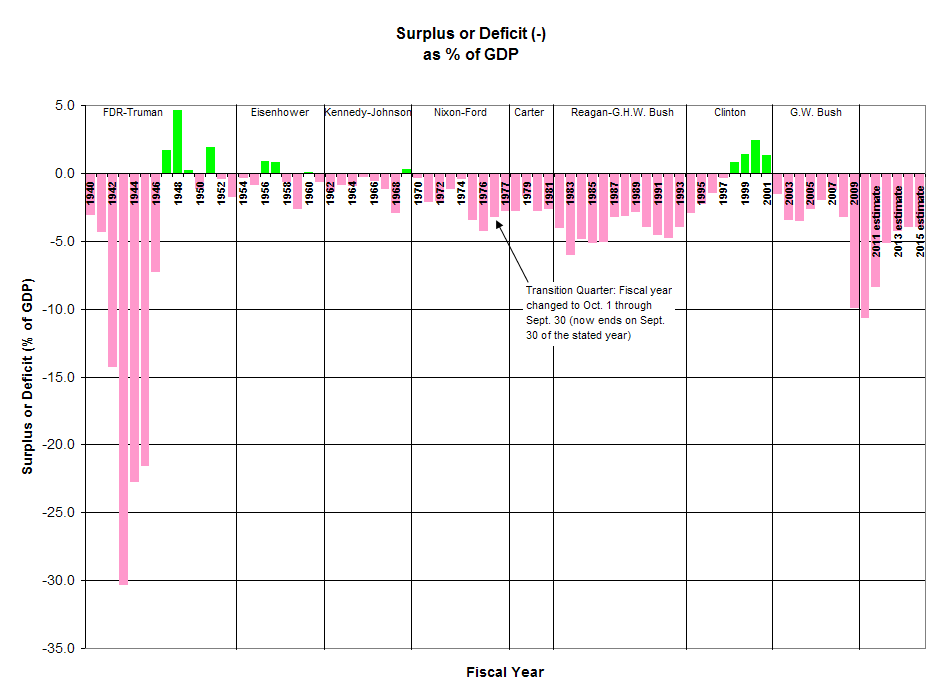
Chart 3. This chart compares Federal debt to GDP. (GDP is the principal annual measure of the national economy. Federal debt is the total amount of debt outstanding, accumulated over the life of the nation, and was about $10 trillion—in current dollars—at the end of fiscal year 2008.)
- From the peak in World War II, GDP grew faster than Federal debt through the Carter administration (with only minor "bumps").
- After debt reached a low of 32.5% of GDP in the first fiscal year of the Reagan administration, the trend was reversed, and debt grew faster than GDP through the remainder of the Reagan and Bush 41 administrations.
- This imbalance was relieved through the Clinton administration; and in his second term, GDP once again grew faster.
- Then the pattern turned again, and debt grew faster than GDP through the Bush 43 administration.
- Fiscal Year 2009 (10/1/08 - 9/30/09) has massivie outlays for TARP and the stimulus, to deal with the financial crisis and the recession generally. The 5-year budget estimate beginning with fiscal year 2010 is that annual deficits will continue through that period. However, these deficits will be of such a size that overall Federal debt will NOT grow faster than GDP.
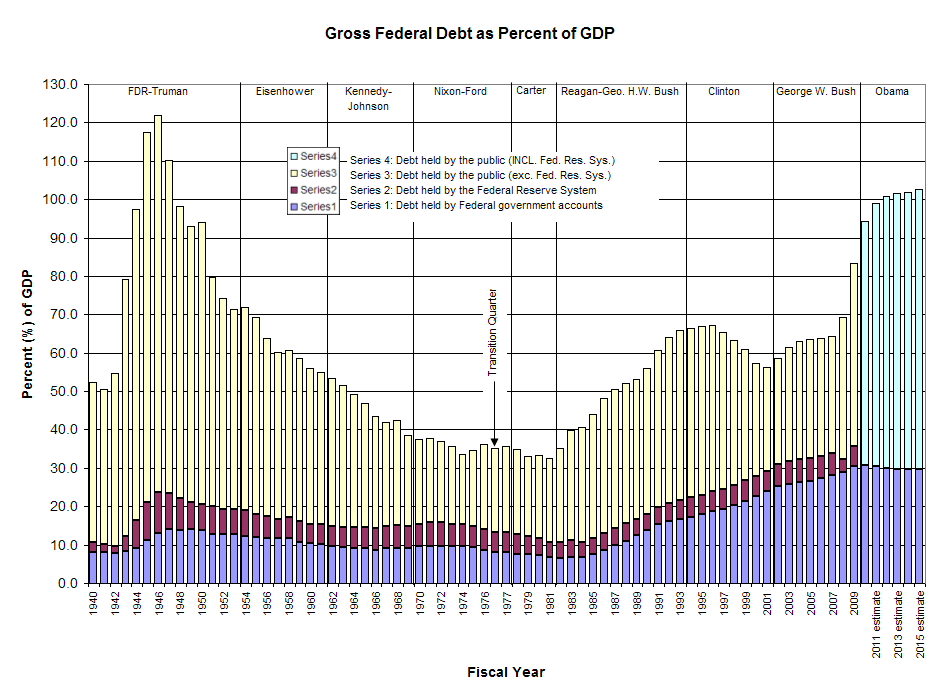
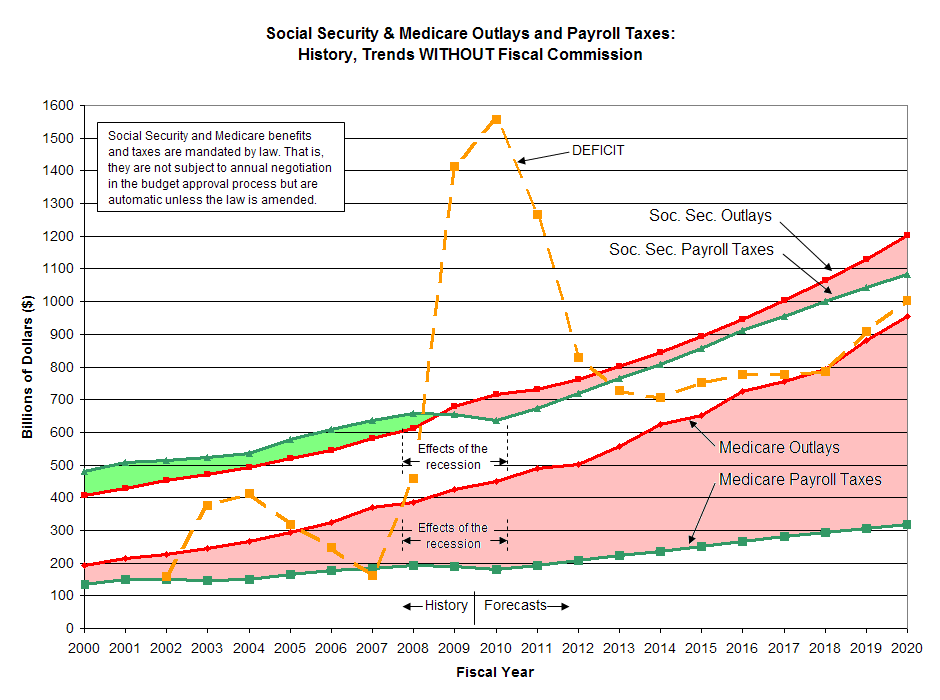
Chart 4. Social Security and Medicare are often mentioned as major contributors to the Federal deficit. Both are now drawing on their trust funds to maintain benefit levels; but the trust funds hold government bonds, since the money paid into the trust funds was borrowed in the past by the government. So the government now must borrow elsewhere when it must redeem the bonds cashed in by the trust funds to pay its obligations.
As the chart shows, Social Security was running a surplus—that is, increasing the size of its trust fund—until 2009. The recession (a) has reduced revenue from Social Security payroll taxes and (b) has resulted in a greater-than-trend increase in Social Security outlays, so that Social Security now is drawing down its trust fund to pay scheduled benefit payments. (The latter may be because people who lost their jobs and were at least 62 years old decided to retire early and start drawing their Social Security.) The size of the Social Security "deficit" is relatively small, and the proposed Fiscal Commission should have little trouble finding a fix by the time the trust fund is depleted—in about thirty years!
As the chart also shows, Medicare already has been drawing on its trust fund for many years; and the size of its annual draw-down now is a major part of the annual Federal deficit. (Note that payments to the trust fund are an obligation to a bond-holder—the trust fund—not a new program obligation.) This draw-down is a result of the high rate of growth in health care costs nationally, since Medicare patients, as well as those using private insurance, are treated in the private sector. These deficits will be reduced only with reform of health care.
| For a discussion of how Federal debt differs in character from household debt, see here. |